WrongCharts
Why WrongCharts?
_introduction
This blog is an attempt to promote better charts through the repeated application of various guidelines and best practices that can (and should) be employed when visualizing data. I did not set out to simply describe how to build effective, simple, attractive charts that can best summarize your data and point out…
Defensive Communication
_introduction
An imperfect but potentially helpful metaphor is to think of Defensive Communication as a variant of Defensive Programming. When collecting and processing data to build charts on our computer (or tablet; or phone), we may encounter various errors for which we can (and should!) prepare ourselves in advance. If something unexpected happens then we can set up an alert so that we are informed of it right away:
try:
plot(my_data)
except:
print(“Something went wrong. Go back and…
try:
plot(my_data)
except:
print(“Something went wrong. Go back and…
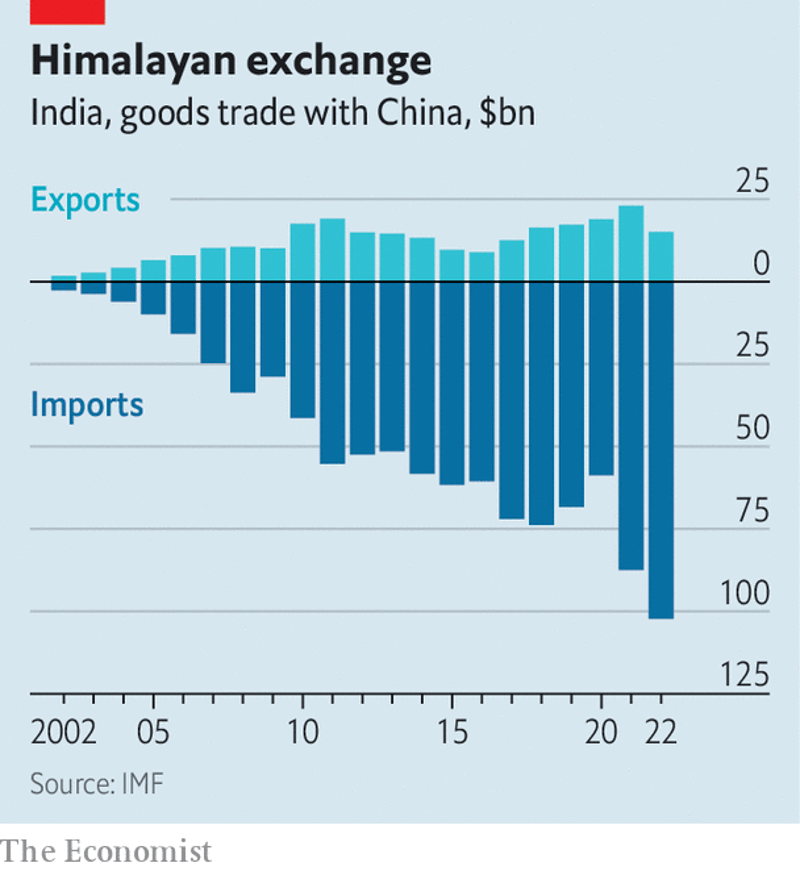
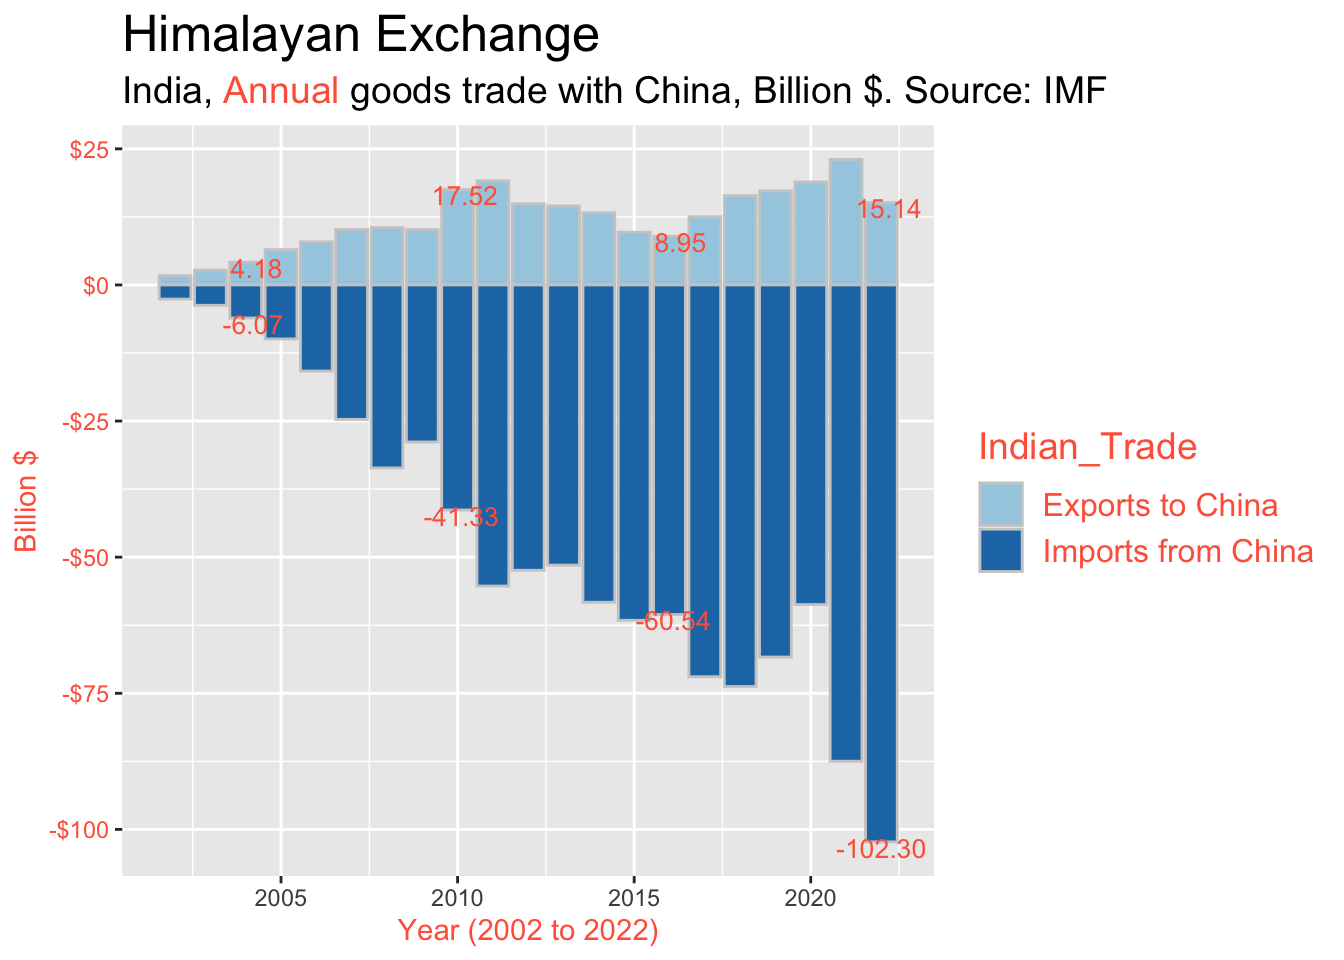
Double Bar Chart
bar charts
I downloaded this chart on 2023-08-29 from https://www.economist.com/business/2023/08/14/can-india-inc-extricate-itself-from-china. As applicable to all original plots on this site, they might no longer be present at the links where I found them by the time you read this: the Internet is always changing. At first sight, everything looks fine: India exports…
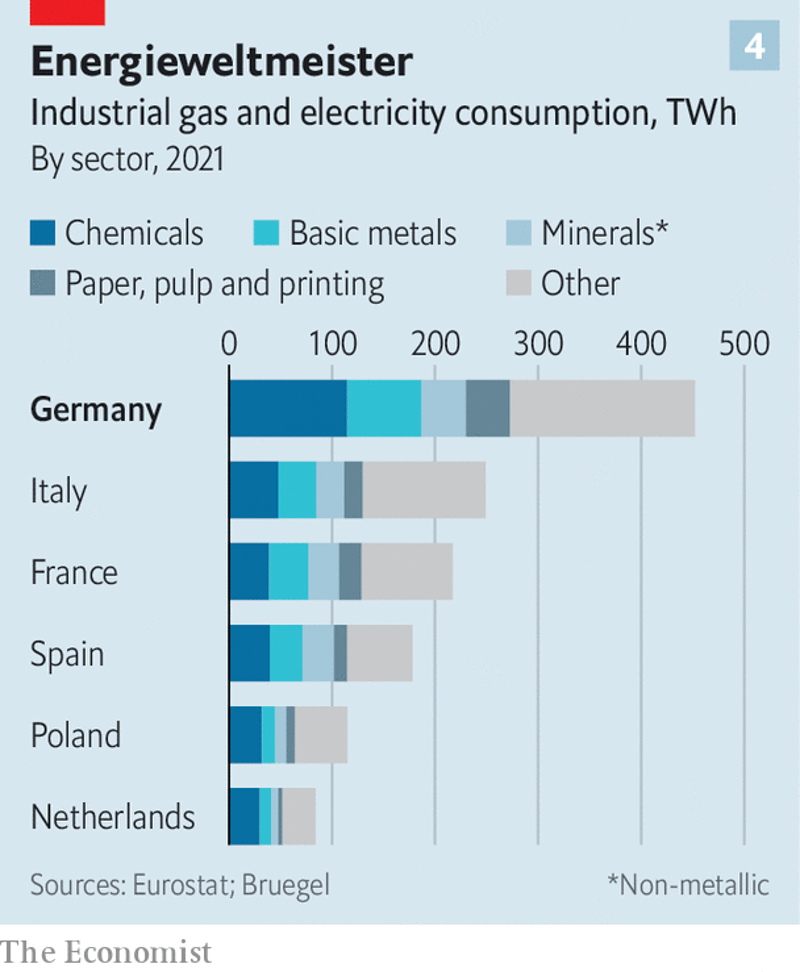
Stacked Bars and Proportions
bar charts
stacked bar charts
I downloaded this chart on 2023-08-30 from https://www.economist.com/finance-and-economics/2023/08/17/the-german-economy-from-european-leader-to-laggard. As applicable to all original plots on this site, they might no longer be present at the links where I found them by the time you read this: the Internet is always changing. At first sight, everything is fine. One thing however which looks rather…
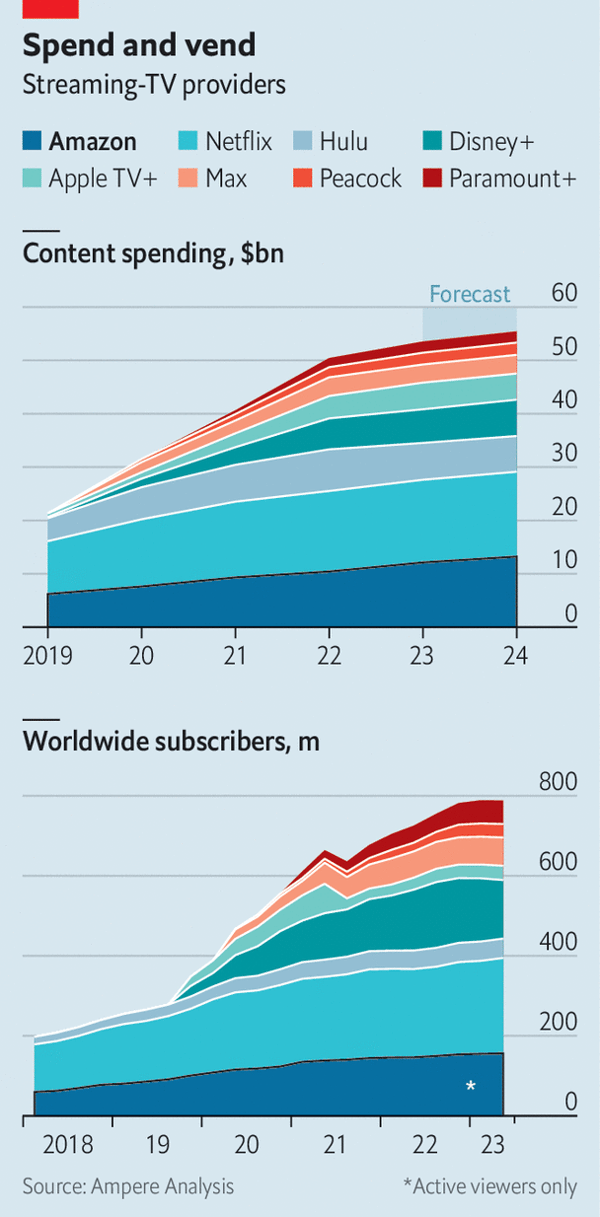
Area Charts
area charts
bar charts
stacked bar charts
line charts
I downloaded this chart on 2023-09-09 from https://www.economist.com/business/2023/08/27/amazon-has-hollywoods-worst-shows-but-its-best-business-model. As applicable to all original plots on this site, they might no longer be present at the links where I found them by the time you read this: the Internet is always changing. My first impression was good. We have some pretty interesting information about streaming TV providers, in an attractive format. Both the content spending and the number of subscribers have been increasing significantly over the last few years. However, the closer you look, the more…
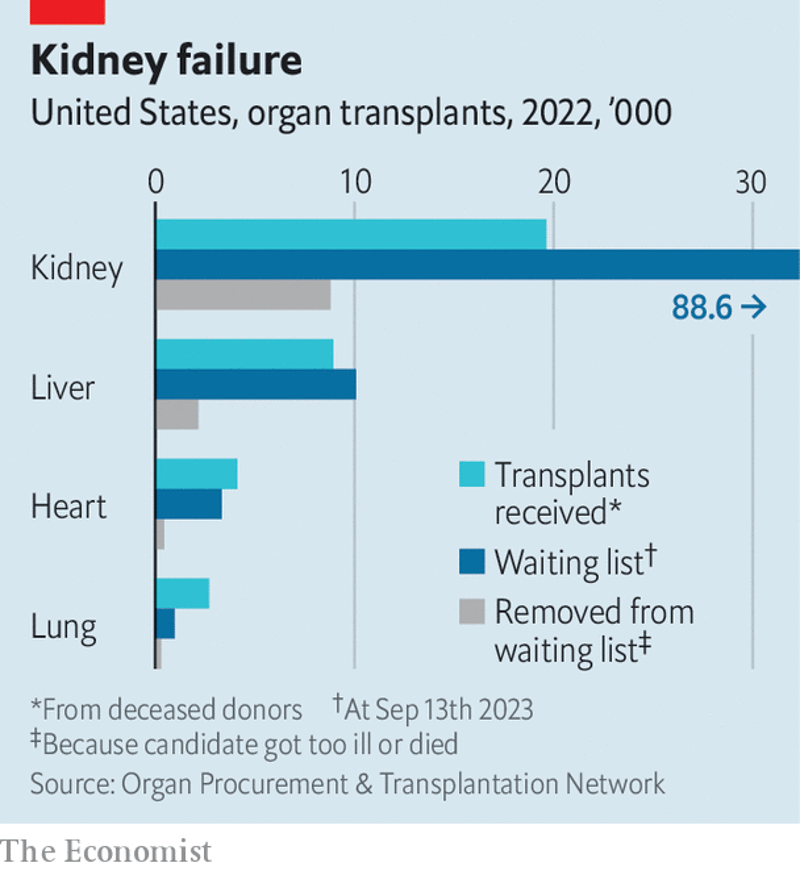
Truncated Bar Charts
bar charts
I downloaded this chart on 2023-09-28 from https://www.economist.com/united-states/2023/09/16/in-america-lots-of-usable-organs-go-unrecovered-or-get-binned. As applicable to all original plots on this site, they might no longer be present at the links where I found them by the time you read this: the Internet is always changing. The one thing that initially drew my attention to this plot was the truncated X axis. I can guess the intention behind that decision: to make the other figures easier to read, by not…
Variable Width Bar Chart
bar charts
I downloaded this chart on 2023-12-01 from https://www.economist.com/special-report/2023/11/20/trees-alone-will-not-save-the-world. As applicable to all original plots on this site, they might no longer be present at the links where I found them by the time you read this: the Internet is always changing. Of all the charts that I read in the last several months, this is by far my favorite…
No matching items